MonoDevelop
MonoDevelop is the integrated development environment (IDE) supplied with Unity. An IDE combines the familiar operation of a text editor with additional features for debugging and other project management tasks. The text editor will not be covered here since it is fairly intuitive, but the integration of the editor and debugger with Unity are described below.
Setting Up MonoDevelop
MonoDevelop is installed by default with Unity, although there is the option to exclude it from the installation on Windows. You should check that MonoDevelop is set as the external script editor in the Preferences (menu: Unity > Preferences and then select the External Tools panel). With this option enabled, Unity will launch MonoDevelop and use it as the default editor for all script files.
Setting Up the Debugger
To enable MonoDevelop’s source level debugging (see below for details) you should firstly check that the Editor Attaching option is enabled in the Preferences on the External Tools panel. Then, you should synchronize the Unity project with the MonoDevelop project (menu: Assets > Open C# Project). Also, make sure that the Development Build and Script Debugging options are enabled in the Build Settings for your target platform (menu: File > Build Settings).
Just before starting a debugging session, select the target you wish to debug from the target list next to the play button (Unity Editor, OSX Player, etc.). You can also select “Attach To Process”, this will show the full list of debuggable Unity processes.
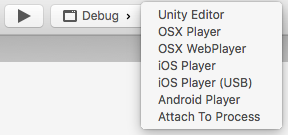 Play button and target list
With these steps completed, you are ready to being debugging your Unity scripts by clicking the play button.
Source Level debugging
The currently open source files are shown as tabs in MonoDevelop and can be edited there with the features of a standard text editor. However, there is also a grey breakpoint bar to the left of the editor panel. Clicking in this bar will add a so-called breakpoint marker next to the line of code.
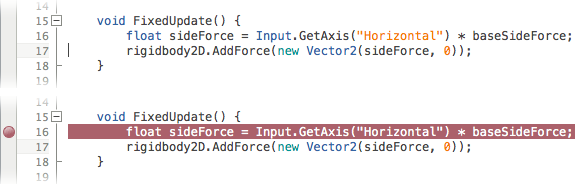 Breakpoint being added to code on line 16
Adding a breakpoint to a line instructs Unity to pause execution of the script just before it reaches that line during Play mode. When the script is “frozen” like this, you can use the debugger to determine exactly what the script is doing.
 The arrow shows execution paused at the breakpoint
Information about the state of execution is shown in the tabs at the bottom of the MonoDevelop window when execution is paused at a breakpoint. Perhaps the most important of these is the Locals tab.
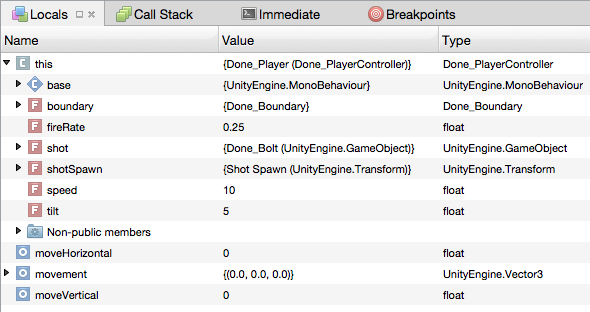 Tab showing variable values
This shows the values of local variables in the function that is currently executing. (A pseudo-local variable called “this” is automatically available in every function without being explicitly defined; it is a reference to the current script instance and so all variables defined in the script can be accessed via “this”.) You can use breakpoints in combination with the Locals tab to get a similar effect to adding print statements to your code — you can interrogate the values of variables at any point you like. However, you can also edit the variable values in the Locals tab. This can be handy when you find a variable incorrectly set and you would like to see if the problem disappears when the value is set how it should be.
A further useful feature of MonoDevelop is single stepping. When execution is paused at a breakpoint, a bar of debugging tools will become available in the top portion of the MonoDevelop window:-
 MonoDevelop stepping tools
The four buttons are known as Continue, Step Over, Step In and Step Out and can also be accessed as commands on the Run menu. Continue resumes execution until the next breakpoint is encountered. Step Over and Step In both execute one line of code at a time. The difference between the two is that Step Over executes any function calls within the line all at once, while Step In allows the stepwise execution to continue into the function. Since it is common to use Step In accidentally on a function that is known to be correct, Step Out continues execution to the end of the current function and then pauses again in the code that originally called it.
A detailed description of source level debugging techniques is not appropriate here but there are various books and web resources offering wisdom on the subject. Additionally, a little experimentation will help you get a feel for the power of the technique and how you can use it to track down most common types of bugs.
Программное средство – Monodevelop: как установить и запустить систему, а также другие полезные советы

Разработка программ требует много знаний и времени, но при этом широко востребована и неплохо оплачивается. Свободная среда разработки даст возможность попробовать себя в роли программиста или поможет с практикой уже опытным специалистам. MonoDevelop – это один из таких инструментов, позволяющих создавать собственное ПО.
Для чего предназначена система?
Свободная система программных средств MonoDevelop предназначена для написания настольных и веб-приложений C#, C, C++, Vala, CIL, Visual Basic .NET. Nemerie, Boo, Java. Будучи портом SharpDevelop на Mono/GTK+ проект начал активно развиваться и сильно отошёл от своих первых версий.
Основные возможности:

- подсветка синтаксиса;
- автоматическое дополнение кода;
- выделение блоков кода с возможностью сворачивания/разворачивания;
- поддержка плагинов;
- браузер классов;
- встроенный отладчик;
- визуальный конструктор форм (GTK#);
- модульное тестирование;
- множество стандартных шаблонов;
- автоматическое создание бинарных пакетов и архивов по завершению компиляции.
Как загрузить и установить?
Загружать MonoDevelop рекомендуется с официального сайта разработчика в разделе «Download», где пользователю доступны на выбор три платформы:
- Windows.
- Linux.
- MacOS.
Кликаем на нужную нам и следуем инструкции (раздел на английском языке!). Владельцам Linux доступны репозитории Mono для каждой версии операционной системы, которые позволяют установить пакет MonoDevelop. Для работы с macOS достаточно загрузить последнюю доступную Visual Studio.
Установка на Windows
Для работы MonoDevelop необходимо сначала подготовиться:

- Устанавливаем свежую версию .NET Framework.
- Заходим на официальный сайт MonoDevelop в раздел «Download».
- Выбираем ОС.
- Нажимаем кнопку скачки и переходим на сайт проекта Mono.
- Загружаем и устанавливаем файлы GTK# и Mono на компьютер.
- Скачиваем Visual Studio и Xamarin от Microsoft, которые понадобятся для этой среды разработки.
Теперь необходимо вручную собрать MonoDevelop из исходника. Для этого и понадобится как минимум Visual Studio 2017:
- git clone https://github.com/mono/monodevelop —recursive -j8;
- открываем main/Main.sln;
- выбираем конфигурацию DebugWin32 и платформу AnyCPU (это важно!);
- получаем готовое ПО.
Как запустить программу?
Запуск программы происходит либо через сторонние универсальные программы для разработки, где MonoDevelop используется в качестве инструмента написания кода, либо из установленного вручную билда. В случае с MSBuild, например, процесс происходит напрямую с помощью скрипта winbuild.bat (запускаем monodevelop\main\build\bin\monodevelop.exe).
Возможные проблемы
Что делать, если система не запускается? Существует множество возможных причин, которые помешают запуску MonoDevelop, и каждая из них требует индивидуального подхода. Если выяснить проблему невозможно, то лучше всего:
- полностью удалить MonoDevelop и установить на чистую ОС;
- проверить наличие всех необходимых программ и обновлений;
- переустановить утилиту, которая связана с MonoDevelop (Unity или Visual Studio, к примеру).
Процесс работы с языком C# сложен и доступен не для многих. Тем не менее, если вам приглянулась идея научиться писать код, то открытая среда разработки MonoDevelop станет отличным решением, особенно для владельцев Linux и macOS.
Как в unity поменять visual studio на monodevelop
Unity: Использовать Visual Studio вместо MonoDevelop
В Unity заходим в Edit -> Preferences… -> External Tools -> External script editor -> Browse… и выбираем путь до запускного файла VS. У меня это «C:\Program Files (x86)\Microsoft Visual Studio 12.0\Common7\IDE\devenv.exe» 
Теперь при двойном клике на файле со скриптом на панели Assets, откроется Visual Studio.
Изменить стандартную IDE в Unity
- Ubuntu 17.10
- MonoDevelop 5.10
- Unity 2017.3.0p2
MonoDevelop
Настройка MonoDevelop
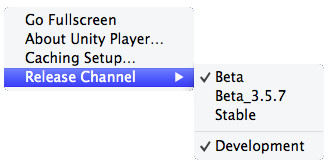 Включение отладки в webplayer
Just before starting a debugging session, select the target you wish to debug from the target list next to the play button (Unity Editor, OSX Player, etc.). You can also select “Attach To Process”, this will show the full list of debuggable Unity processes.
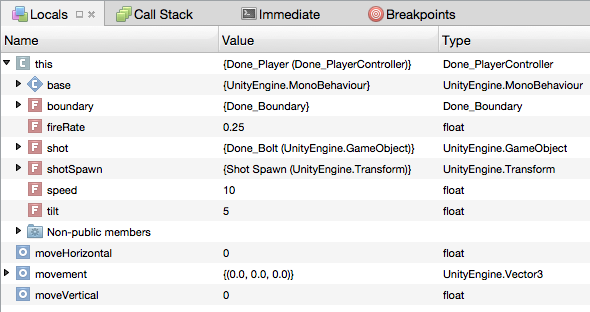 Вкладка, показывающая значения переменных
With these steps completed, you are ready to being debugging your Unity scripts by clicking the play button.
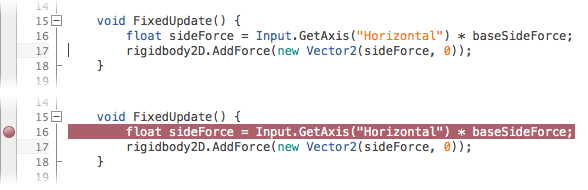 Breakpoint, добавленный в код а строке 16
 Стрелка показывает, что выполнение приостановлено на точке останова
Вкладка, показывающая значения переменных
 Инструменты пошаговой отладки MonoDevelop