Active Session History (ASH)
For a long time DBAs have been encouraged to use variations on the YAPP method of performance tuning, which focuses on wait event monitoring, rather than hit ratios. Tools like Statspack, AWR, ADDM and SQL Trace are all very useful for gathering wait event information during tuning, but they tend to focus on looking back at what has happened, rather than what is currently happening. The [G]V$ dynamic performance views provide masses of real-time information, but it can be difficult for beginners and experienced people alike to make good use of this information.
Oracle 10g introduced the Active Session History (ASH) as part of the Diagnostics and Tuning Pack. It samples information from the [G]V$ views allowing you to see current and historical information about active sessions on the database.
Being part of the Diagnostics and Tuning Pack means ASH is only available as a paid option on top of Oracle Database Enterprise Edition.
V$ACTIVE_SESSION_HISTORY
Samples of wait event information are taken once per second and made available using the V$ACTIVE_SESSION_HISTORY view. An active session is one that is waiting on CPU or any event that does not belong to the «Idle» wait class at the time of the sample. The sample information is written to a circular buffer in the SGA, so the greater the database activity, the less time the information will remain available for.
The V$ACTIVE_SESSION_HISTORY view is essentially a fact table, which can be linked to a number of dimensions to provide statistics specific to a variety of things including SQL statements, execution plans, objects, wait events, sessions, modules, actions, client identifiers, services and consumer groups etc. This makes it an incredibly flexible way of identifying what active sessions are doing, or have done. For example, if I wanted to see the main activity on the database for the last 5 minutes, I could use the following query.
Notice how the count of the samples is used to determine the time waited, not the WAIT_TIME or TIME_WAITED columns. Why is this done? Remember, this is sample data, so wait times are accumulating with each sample. Merely summing them will give a falsely high value. To explain this, imagine simplified case where a single session is waiting on «db file sequential read» for 5 seconds. That means we would have 5 samples, that may look like this.
We know the total wait time is 5 seconds. If we count the number of samples, we get 5, which we equate to 5 seconds. If we sum the time for all 5 samples get 15 seconds.
The time columns in the ASH data are a little more complicated than they first appear, so check the documentation when using them. Incorrect usage of these columns is probably the most common mistake people make when using ASH views.
The fact ASH uses samples can of course mean certain bits of information slip through the net, but this is not really a problem. The chances are your main concerns will be those sessions or statements that are taking lots of time. The longer things take to run, the more samples they are likely to be picked up in. It is unlikely that anything of major concern will completely fail to register in the ASH views, but that doesn’t mean you can ignore its limitations.
DBA_HIST_ACTIVE_SESS_HISTORY
To allow for historical access to the ASH data, one in ten samples are persisted to disk and made available using the DBA_HIST_ACTIVE_SESS_HISTORY view. So this is a sample of a sample. Using this view is similar to using the V$ACTIVE_SESSION_HISTORY view, but remember the sample time is now 10 seconds, so use (count*10) to measure time, rather than just the count.
Enterprise Manager Performance Pages
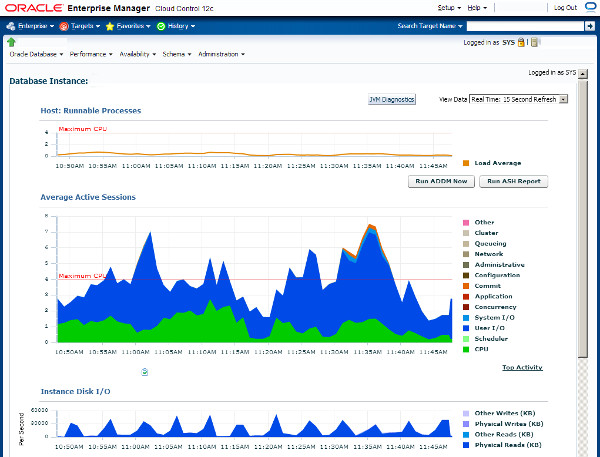
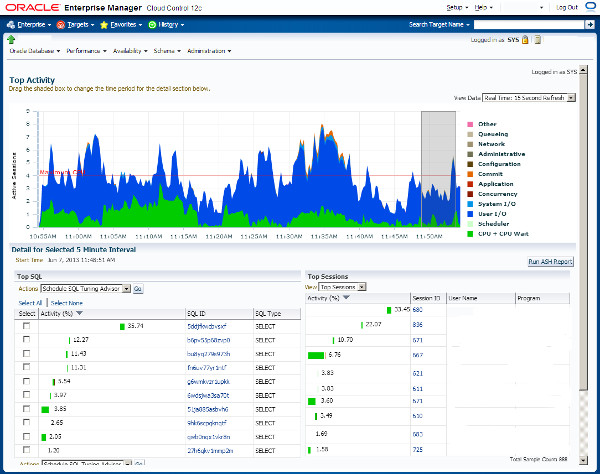
Accessing the ASH information directly can be very useful, but there are a number of more efficient ways to get to some of this information. The performance pages of Enterprise Manager (Grid Control and Cloud Control) are fantastic. They are based on the ASH information, giving you easy access to real-time and historical performance information.
The following picture is an example of the Enterprise Manager performance home page.
An example of the Top activity page is shown below.
ASH Report
ASH reports can be displayed using Enterprise Manager, or generated from SQL*Plus. To manually generate them using SQL*Plus, run the following script, while logged in as a privileged user.
The script prompts you for the following details:
- Report Type: [ html | text ]
- Instance number: [all | n ] — On single instance databases, this defaults to «1». On RAC databases you can report on a specific instance number or «all» instances.
- Begin Time: The script describes the formats for this value. It can be an explicit date string or an offset of the current datetime. The default is -15 minutes.
- Duration: The number of minutes to report on. The default duration is (SYSDATE — begin_time).
- Report Name: A default name is provided. Change this if required.
The script produces either text or HTML output as requested. Examples of these are shown below.
Depending on the options selected, the ASH report scripts call one of several table functions from the DBMS_WORKLOAD_REPOSITORY package.
- ASH_REPORT_TEXT
- ASH_REPORT_HTML
- ASH_GLOBAL_REPORT_TEXT
- ASH_GLOBAL_REPORT_HTML
SQL Developer and ASH Reports
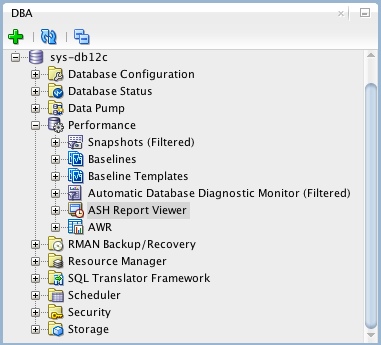
If you are using SQL Developer 4 onward, you can view ASH reports directly from SQL Developer. If it is not already showing, open the DBA pane «View > DBA», expand the connection of interest, then expand the «Performance» node. The ASH reports are available from the «ASH Reports Viewer» node.
ASH Viewer
The ASH Viewer tool gives a graphical view of active session history data within the Oracle instance. Interestingly, it is supports Oracle 8i onward. In releases prior to Oracle 10g, or if you don’t have a Diagnostic and Tuning Pack license, you can connect using the «Standard» connection and the tool will mimic the functionality of ASH. If you have the necessary licenses, you can make «Enterprise» connections, which use ASH to provide the data.
Почему долго висят сессии в статусе killed в Oracle 12.2.0.1?
В последнее время стали все чаще висеть сессии в статусе killed и долгое время (от 1 дня до недели) они не уходят, убивать их не желательно, так как они делают rollback, если принудительно убить подобные сессии база просит запустить ее в режиме восстановления. Кто-нибудь сталкивался с подобным, как решали проблему? Поделитесь знаниями?
Oracle 12.2.0.1, двухнодовый RAC, ASM
На Oracle 11g подобной проблемы вообще не наблюдалось
- Вопрос задан более трёх лет назад
- 1269 просмотров
- Вконтакте

Попробуй посмотреть ноты:
You did not commit your transactions and the session were accidentally
killed. Your transactions are rolling back and it is taking a long time.
Rollback started hours ago and is still in progress.
You want to know if there is any way to speed up the process such as using
cleanup_rollback_entries in the init.ora and then restarting the database.
You also want to know what will happen if you shutdown the database after 12
hours of rollback. Will the rollback pick up where it left off?
There is no way to speed up the rollback process and there is no formula for
determining how long it will take to complete. It depends on what type of
undo the application has generated. Some undo may take little space in an
undo block, but may take awhile to apply.
You can look at used_ublk in V$transaction to estimate how long it is going
to take to complete the rollback.
SQL> SELECT a.used_ublk
FROM v$transaction a, v$session b
WHERE a.addr = b.taddr AND b.sid = ;
If used_ublk showed 29,900 12 hours ago and is now 22,900, it has
taken 12 hours to rollback 7,000 entries. It will take approximately
another 36 hours to complete depending on the types of transactions
that are rolling back.
CLEANUP_ROLLBACK_ENTRIES determines how long SMON will be holding onto one
transaction’s resources. It only affects recovery of transactions in the
background such as after an instance crash. It doesn’t affect rollback
by the transaction itself.
Rollback will pick up where it left off if you do shutdown after 12 hours
of rollback.
You can use V$transaction used_ublk to estimate how long the rollback is
going to take but there is no formula for this. If you shutdown the
database after rollback has started, it will begin where it left off.
For Oracle 9i and onwards ,check :
SQL> SELECT DISTINCT ktuxesiz
FROM x$ktuxe
WHERE ktuxecfl=’DEAD’;
Note:30696.1 «PARAMETER: INIT.ORA: CLEANUP_ROLLBACK_ENTRIES»
Related information can be found in Note 231713.1 — Database appears hanging but generates huge amount of redo and
archived redo logs.
APPLIES TO:
Oracle Database — Enterprise Edition — Version 7.0.16.0 and later
Information in this document applies to any platform.
PURPOSE
This document briefly describes how to suppress sessions marked killed in v$session.
SCOPE
Killing oracle sessions useful snippet for DBAs.
DETAILS
ALTER SYSTEM KILL Session Marked for Killed Forever:
You have a session that you have killed, but it seems as though it will not go away:
SQL> alter system kill session ‘sid, serial#’;
SQL> select status, username from v$session;
You have issued this several times and it seems it still is marked as killed.
In order to determine which process to kill:
a) On a Unix platform:
SQL> SELECT spid FROM v$process WHERE NOT EXISTS ( SELECT 1 FROM v$session WHERE paddr = addr);
SQL> SELECT inst_id, status, event, state, blocking_session, sid, serial#, program FROM gv$session WHERE status = ‘KILLED’;
b) On a Windows platform:
SQL> SELECT spid, osuser, s.program FROM v$process p, v$session s WHERE p.addr=s.paddr;
Then use the orakill utility at the DOS prompt:
where = the Oracle instance name (ORACLE_SID) = the thread id of the thread to kill
The simplest (and probably most common) reason the session stays around is because the process is still around. The reason the process is still around is because it is waiting on «SQLNet message from client». If it does ever get a message, it will then respond with an ORA-28 «Your session has been killed» error number. At that point the session should go away. The dedicated server process may remain alive until the client disconnects or exits.
PMON may take ownership of the session while it is cleaning up any resources held by the session at the time it was killed. If it cannot clean everything up immediately it will leave the session under the PSEUDO process while performing other tasks.
By finding the spid you can then force the process to be killed. When issuing the ‘kill’ command be sure that you kill «DEDICATED SERVER PROCESSES», those called:
where is the ORACLE_SID.
Be sure you do not kill processes such as:
Note:100859.1 ALTER SYSTEM KILL SESSION does not Release Locks Killing a Thread on Windows NT
Note:1041427.6 KILLING INACTIVE SESSIONS DOES NOT REMOVE SESSION ROW FROM V$SESSION
Note:1023442.6 HOW TO HAVE ORACLE CLEAN-UP OLD USER INFO AFTER KILLING SESSION UNDER MTS
Note:387077.1 How to find the process identifier (pid, spid) after the corresponding session is killed?
Сессии к базе данных Oracle
Заменить ‘SID’ и ‘Serial#’ на текущие значения сессии.
Убийство всех сессий к определенной схеме
Отследить, какой запрос выполняет приложение
Tags: Oracle Database, Sessions
Oracle DBA
Лучше потратить какое-то количество времени, чтобы записать успешный опыт, чем потом повторно воспроизводить его по памяти.
Все материалы обновляются по мере нахождения лучших практик и апгрейда знаний. Если будут желающие добавлять свои знания или исправлять ошибки и неточности, пишите в телеграм чате. Если будет учавствовать больше людей, качество материалов будет улучшаться и обновляться быстрее. Ссылки на ваши профили в соц. сетях будут добавлены в статьях, в которых вы учавствуете.