Установка Qt под Visual Studio, MinGW и для разработки под Android

Инструкция по установке Qt с компилятором Visual Studio, MinGW и возможностью программировать под Android на примере Windows 10.
Если вы хотите установить Qt просто, чтобы программировать на C++ под Windows с стандартным компилятором, то вам подойдет упрощенная установка, описанная тут: Установка Qt.
Если вы хотите установить Qt под Windows XP, то данная статья вам не подойдет, так что вам сюда: Установка Qt 4.8.4 на Windows XP.
Подготовка для работы с компилятором Visual Studio
Если вы хотите использовать компилятор под Visual Studio, то вам нужно установить Visual Studio. В статье Установка Visual Studio 2017 Community рассказывается как это сделать.
Если вы хотите разрабатывать универсальные UWP приложения, то не забудьте включить режим Режим разработчика в параметрах Windows 10:


Решите до установки Qt, какой язык интерфейса будет у Visual Studio. От этого зависит язык сообщений об ошибках, которые будут приходит при компилировании проектов в Qt.
Можно язык поменять в настройках Visual Studio:


Но сейчас я предпочитаю в установщике Visual Studio Installer удалить русский пакет и установить английский, чтобы русский язык вообще нигде не вылазил:


Подготовка для программирования под Android
Если вы хотите писать приложения под Android, то вам нужно установить JDK. Об этом можно узнать из статьи Установка JDK 8 в Windows. Обратите внимание, что на июль 2019 рекомендую устанавливать по прежнему Java 8, хотя уже вышла Java 12, так как Qt с ними еще не умеет нормально работать. Но может в момент вашего прочтения этой статьи уже всё поменялось:

Также вам будет нужен Android SDK и Android NDK. Можно их скачать отдельно, но рекомендую поставить Android Studio и оттуда управлять SDK и NDK с нормальным механизмом обновления. Статья об установке: Установка Android Studio в Windows. Особое внимание уделите на установку пакетов SDK из статьи.
Только после установки необходимых вам программ можно приступать к установке Qt.
Установка NDK
Как было сказано выше, то для тех, кто хочет программировать на Qt под Android, то вам нужен Android NDK.
Итак, после установки Android Studio открываем её. Либо так:


В разделе SDK Tools отмечаем NDK и устанавливаем его:


Теперь Android Studio можно закрывать.
Скачивание Qt
Практика нескольких лет наблюдений показывает, что Qt регулярно меняет алгоритм нахождения open source версии установщика, так что учтите это.
Там вам нужно спуститься почти в самый низ:

И там находите Go open source :

Нам рекомендуют скачать online установщик. Раньше я ставил через offline установщик, но для установки версий MinGW, Visual Studio, Android приходилось устанавливать через несколько инсталляторов, и обновляются такие сборки реже. Так что скачиваем online установщик через кнопку Download , ссылка на который находится в самом низу страницы (на 2020-02-09):


Если же вам нужен всё-таки offline установщик, то спуститесь в самый низ и увидите ссылку на них:

Установка
Запускаем скаченный файл:

Если у вас есть учетка на сайте Qt, то вводите данные, иначе нажимаете Skip :


В списке компонентов выбираем Qt Creator:

В последней версии Qt выбираем пакеты с нужными компиляторами.
- MSVC — это компилятор под Visual Studio. Например, MSVC 2017 64 bit означает версию компилятора по Visual Studio 2017 в виде 64-битной версии. Выбирайте пакеты согласно вашей версии Visual Studio и битности операционной системы.
- UWP — это версия пакета под компилятор Visual Studio для написания универсальных приложений Windows 10
- MinGW — компилятор MinGW для написания десктопных приложений. Для работы с ним не нужно ничего дополнительного устанавливать, как с другими пакетами.
- Android ARMv7 и Android x86 — позволят компилировать приложения под Android на разных семействах процессоров.
- Sources — Если вам нужны исходники классов Qt библиотек, то выбирайте этот пункт.
Лично мне у меня 64-битная Windows 10 с Visual Studio 2017 Community, и мне нужно проверять программы как на компиляторе Visual Studio, так и на MinGW. А также нужно программировать под Android. Поэтому я отметил вот эти пакеты:

Sources — исходники Qt можно не выбирать, если они вам не нужны.
Рекомендую также выбрать для установки дополнительные компоненты. Их можно выбирать все:

Если вам интересна программа Qt 3D Studio и Qt Installer Framework, то можете их отметить:

Соглашаемся с условиями:

Лично я у себя в этом окне ввожу Программирование\Qt , но тут для скриншота оставил стандартное значение:


Настройка
Если Qt Creator запустился с русским интерфейсом, то настоятельно рекомендую поменять его на английский:


Потом перезапустите Qt Creator:

Если вы создадите какой-нибудь проект в Qt и скомпилируете его под разными режимами (Release, Debug), то у вас в папке, где находится папка с проектом появятся еще папки с скомпилированным проектом:

На мой взгляд это крайне неудобно и засоряет папку, где у вас могут находится другие проекты. Лучше было бы, чтобы эти скомпилированные файлы располагались в специальной папке в папке проекта. Поэтому я меняю в настройках путь. Вы можете не менять — это не принципиально.
Первоначальное значение параметра Default build directory :

Новое значение параметра Default build directory :

Update 2019-07-13. Сейчас у меня стоит такое значение:
И да. Для тех, кто использует Git. В файле .gitignore я добавляю следующую строчку:
Настройка для работы с компилятором Visual Studio
Если у вас Visual Studio с русским интерфейсом, то в сообщениях об ошибках при компилировании в Qt вы будете видеть крякозябры. В статье Крякозябры в Qt под Visual Studio рассказывается как от них избавиться.
Можно поменять язык интерфейса Visual Studio на английский, но лучше это сделать до установки Qt, как говорилось выше. Но если вы все-таки это сделали после установки Qt, и новые проекты хорошо компилируются под компилятором Visual Studio, то со старыми проектами могут возникнуть проблемы:


Эти ошибки можно исправить либо удалив полностью build папку с собранным проектом, либо удалив оттуда файл с расширением .qmake.stash . Про предварительное удаление файла *.pro.user тоже не забывайте.
Настройка для программирования под Android
Перейдем в настройки Qt:
Находим вкладку Devices , а там вкладку Android . В разделе JDK Location месторасположение JDK должно определиться автоматически. Если не так, то найдите этот путь и укажите тут в настройках:

В разделе Android SDK Location выбираем папку, где установлено SDK библиотеки:

В разделе Android NDK Location выбираем папку, где установлено NDK библиотеки:

Нажмите кнопку OK :

Update 2019-07-13. Практика показывает, что Qt не всегда поспевает за изменениями в Android SDK и NDK. Поэтому иногда требуются шаманства с бубном, чтобы всё заработало. Причем каждый раз будут свои проблемы. Что делать? Гуглите те сообщения об ошибках, которые у вас будут возникать и ищите ответ на https://forum.qt.io/. Например, на данный момент Qt не собирает приложения с Android SDK Build-Tools 29 и ему нужна версия 28.
Вначале удаляем 29 версию:

Потом устанавливаем 28 версию и те пакеты, которые удалились вместе с 29 версией:


Update 2019-07-13. С NDK также могут быть проблемы, так что велика вероятность, что последняя версия NDK у вас не заработает. Тут рекомендую скачать старую версию NDK на официальном сайте https://developer.android.com/ndk/downloads/older_releases. На момент обновления статьи работала NDK версии 19:

Распакуйте отдельно данный архив и укажите в Qt, когда до этого дойдет дело (об этом читайте ниже в статье):

Если у вас проблемы с эмулятором, то помните, что в конце статьи Установка Android Studio в Windows есть описание того, как создать виртуальные устройства в стандартном эмуляторе, а также рассмотрены несколько других сторонних эмуляторов.
Пример программы
В статье Базовое приложение в Qt Widgets рассказано как создать стандартное Windows приложение со стандартными контролами. Теперь же попробуем создать шаблонное приложение на основе Qt Quick, где логика пишется на C++, а интерфейс на QML:

Выбираем вариант Qt Quick Application — Swipe:


Выберем для теста все возможные компиляторы для сборки проекта:


Вначале скомпилируем проект под стандартный MinGW, который мы никак выше не настраивали (это и не нужно):


Теперь попробуем скомпилировать через компилятор Visual Studio:

Может возникнуть такая ошибка:

Если у вас возникнет такая ошибка, то закройте Qt Creator, удалите папку со сборкой проекта (у меня это папка _build ), а в папке с проектом удалите файл *.pro.user . Потом откройте заново Qt Creator, откройте в нем проект и заново скомпилируйте проект и запустите его:

Теперь попробуем запустить под Android на эмуляторе:


Потом можно повторить историю с запуском приложения как универсальное приложение Windows:


Обратите внимание на то, что именно с UWP чаще всего возникают проблемы с запуском приложения из-за обновлений Qt и Visual Studio. У меня было много раз, когда после обновления первого или второго продукта UWP приложения с теми или иными сообщениями не хотели запускаться.
Update 2019-07-13. Если честно, то лично у меня работа с UWP приложениями в Qt почти всегда не работает после переустановки Qt и сопутствующих программ. И лишь танцы с бубном иногда спасают ситуацию. Но, например, в данный момент даже они не помогли, и еще до этапа компиляции проекта выводится вот такая ошибка:

В своё время была долгая беседа в баг-трекере по поводу этой ошибки: https://bugreports.qt.io/browse/QTCREATORBUG-21366, и программисты Qt никак не могли решить её. В тот раз всё разрешилось обновлением Visual Studio. В чем было дело: я не знаю. Может реально в обновлении было что-то исправлено, или это повлияло лишь косвенно. Но на данный момент такая же проблема у меня проявляется опять и как её решить я не знаю.
Дополнительные настройки
В этом разделе опишу свои собственные настройки Qt, которые не обязательны, но могут вам пригодиться.
Вертикальная линия для ограничения длины строк
Рекомендую поставить вертикальную линию в редакторе кода, чтобы следить за длиной строчек кода в параметре Display right margin at column . Я использую значение равное 120 :

Два пробела для отступов вместо четырех
Мне не нравится использовать 4 пробела в отступах: 2 пробела достаточно:


Дублирование строки
Во многих редакторах команда Ctrl + D дублирует строчку, тогда как в Qt Creator данная команда выполняется через Ctrl + Alt + Down . Неудобно, поэтому поменяем. В настройках горячих клавишах находим команду CopyLineDown :

Меняем сочетание клавиш на Ctrl + D . Но мы увидим конфликт, так как на эту комбинацию клавиш назначена другая команда:

Найдем эту команду DeleteSelectedElements и удаляем сочетание горячих клавиш или меняем на другое:

Теперь конфликта нет, и комбинация Ctrl + D будет дублировать строку:

Шрифты
Мне нравится шрифт Roboto Mono : красивый, бесплатный (лицензия Apache 2.0), используется по умолчанию в Android. В общем, везде его использую.
После установки шрифтов в настройках Qt можно поменять шрифт:


Обидно, что расстояние между строчками немного уменьшилось.
Автосохранение
Также выставляю автосохранение файлов на минимальное время в одну минуту:
 <ul><li>Qt logo 2016.svg by Qt Project / (2019-01-26)</li></ul>
Статья обновлена 2019-07-13
- Установка
- Qt
- MinGW
- blog
- it
- program
Инструкция по установке Qt с компилятором Visual Studio, MinGW и возможностью программировать под Android на примере Windows 10.
Инструкция по установке Qt с компилятором Visual Studio, MinGW и возможностью программировать под Android на примере Windows 10.
Установка поддержки C++ в Visual Studio Code (VSCode)

Для разработки программ на языке c++ вы можете использовать среду разработки Visual Studio Code (VSCode).
Сегодня мы рассмотрим установку поддержки языка программирования с++ в этой IDE.
Выбор компилятора
Перед установкой расширения для поддержки с++ в VSCode нам нужно сначала определиться какой компилятор использовать.
Под Windows существует несколько возможностей:
- Вы можете использовать Windows Subsystem for Linux (WSL) и установив в виртуальной машине все необходимые пакеты компилировать программы с помощью специального расширения для VSCode.
- Вы можете установить MinGW или MSYS2 и использовать их компиляторы.
- Вы можете установить компилятор Microsoft C++ compiler (MSVC)
Сегодня мы рассмотрим самый простой способ – установку Microsoft C++ compiler (MSVC).
Установка Microsoft C++ compiler (MSVC)
Для начала скачаем установщик по ссылке:
Скачиваем файл, в моем случае он называется:
Запускаем, откроется окно:
Будет запущена консоль разработчика:
Компилятор успешно установлен и доступен.
Теперь пришло время установить расширение для поддержки с++ в VSCode.
Установка расширения для поддержки С++ в VSCode
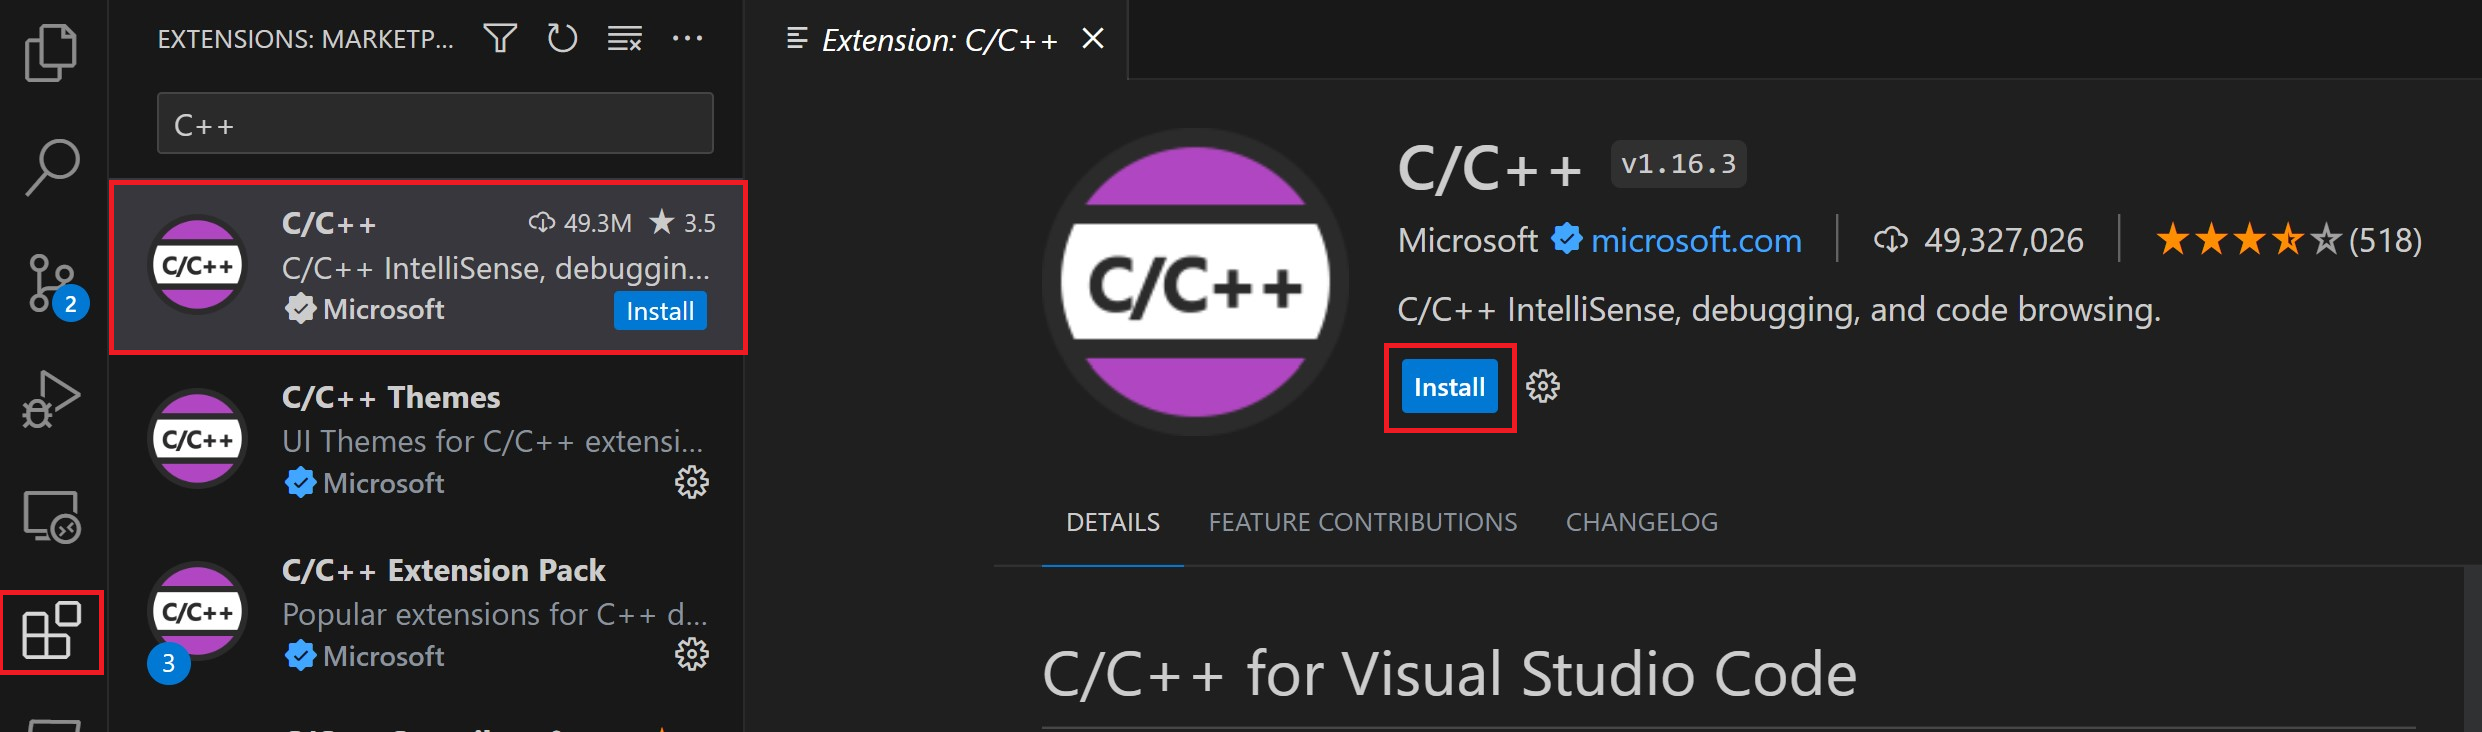
Откроется панель Extensions: Marketplace – это каталог, из которого мы можем скачать все необходимые расширения и темы, достаточно знать их название.


Выберите указанный пункт и нажмите install

Будет начато скачивание дополнительных компонентов. После окончания загрузок расширение будет готово к использованию.
Настройка VSCode для использования компилятора MSVC
Для того, чтобы протестировать работу компилятора создадим тестовый проект.
Для нормального функционирования компилятора MSVC нужно установить несколько переменных окружения. Чтобы упростить задачу воспользуемся Visual Studio 2019 Developer Command Prompt.
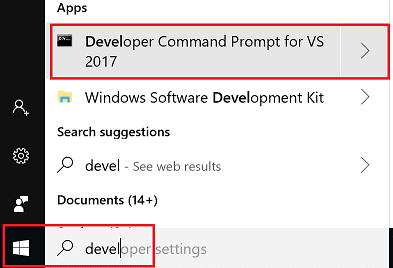
Запустите его из меню Пуск введя слово developer, откроется консоль:
Создадим данную папку и перейдем в нее:
Создадим папку для проекта test
Запустим VSCode из этой папки
Откроется окно VSCode

Обратите внимание наша папка уже открыта.
Добавим новый файл для этого нажмите на кнопку:
Настройка компилятора для проекта
Теперь у нас есть программа, осталось её скомпилировать, давайте настроим задачу сборки для проекта.
Configure VS Code for Microsoft C++
In this tutorial, you configure Visual Studio Code to use the Microsoft Visual C++ compiler and debugger on Windows.
After configuring VS Code, you will compile and debug a simple Hello World program in VS Code. This tutorial does not teach you details about the Microsoft C++ toolset or the C++ language. For those subjects, there are many good resources available on the Web.
If you have any problems, feel free to file an issue for this tutorial in the VS Code documentation repository.
Prerequisites
To successfully complete this tutorial, you must do the following:
Install the C/C++ extension for VS Code. You can install the C/C++ extension by searching for ‘c++’ in the Extensions view ( ⇧⌘X (Windows, Linux Ctrl+Shift+X ) ).
Install the Microsoft Visual C++ (MSVC) compiler toolset.
If you have a recent version of Visual Studio, open the Visual Studio Installer from the Windows Start menu and verify that the C++ workload is checked. If it’s not installed, then check the box and select the Modify button in the installer.
You can also install the Desktop development with C++ workload without a full Visual Studio IDE installation. From the Visual Studio Downloads page, scroll down until you see Tools for Visual Studio 2022 under the All Downloads section and select the download for Build Tools for Visual Studio 2022.

This will launch the Visual Studio Installer, which will bring up a dialog showing the available Visual Studio Build Tools workloads. Check the Desktop development with C++ workload and select Install.

Note: You can use the C++ toolset from Visual Studio Build Tools along with Visual Studio Code to compile, build, and verify any C++ codebase as long as you also have a valid Visual Studio license (either Community, Pro, or Enterprise) that you are actively using to develop that C++ codebase.
Check your Microsoft Visual C++ installation
To use MSVC from a command line or VS Code, you must run from a Developer Command Prompt for Visual Studio. An ordinary shell such as PowerShell, Bash, or the Windows command prompt does not have the necessary path environment variables set.
To open the Developer Command Prompt for VS, start typing ‘developer’ in the Windows Start menu, and you should see it appear in the list of suggestions. The exact name depends on which version of Visual Studio or the Visual Studio Build Tools you have installed. Select the item to open the prompt.
You can test that you have the C++ compiler, cl.exe , installed correctly by typing ‘cl’ and you should see a copyright message with the version and basic usage description.
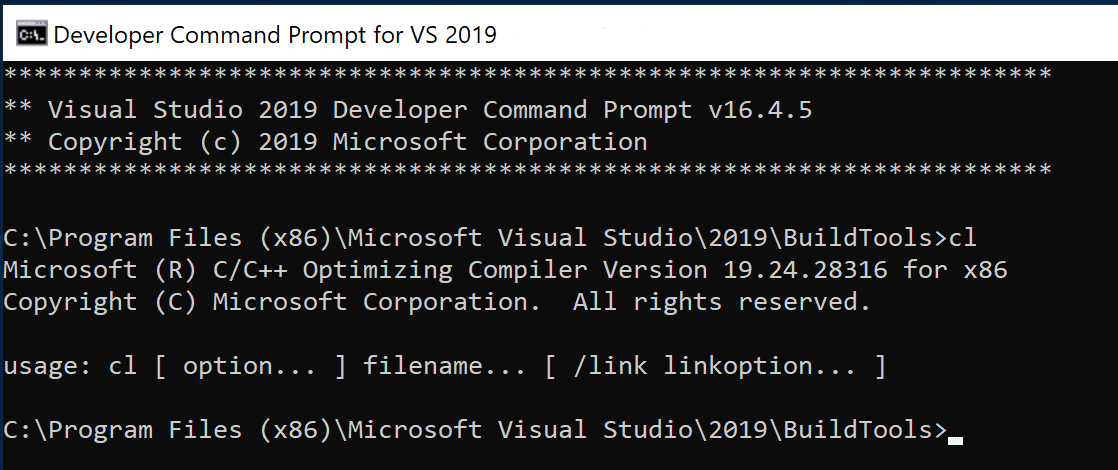
If the Developer Command Prompt is using the BuildTools location as the starting directory (you wouldn’t want to put projects there), navigate to your user folder ( C:\users\
Note: If for some reason you can’t run VS Code from a Developer Command Prompt, you can find a workaround for building C++ projects with VS Code in Run VS Code outside a Developer Command Prompt.
Create Hello World
From the Developer Command Prompt, create an empty folder called "projects" where you can store all your VS Code projects, then create a subfolder called "helloworld", navigate into it, and open VS Code ( code ) in that folder ( . ) by entering the following commands:
The "code ." command opens VS Code in the current working folder, which becomes your "workspace". As you go through the tutorial, you will see three files created in a .vscode folder in the workspace:
- tasks.json (build instructions)
- launch.json (debugger settings)
- c_cpp_properties.json (compiler path and IntelliSense settings)
Add a source code file
In the File Explorer title bar, select the New File button and name the file helloworld.cpp .
Add hello world source code
Now paste in this source code:
Now press ⌘S (Windows, Linux Ctrl+S ) to save the file. Notice how the file you just added appears in the File Explorer view ( ⇧⌘E (Windows, Linux Ctrl+Shift+E ) ) in the side bar of VS Code:
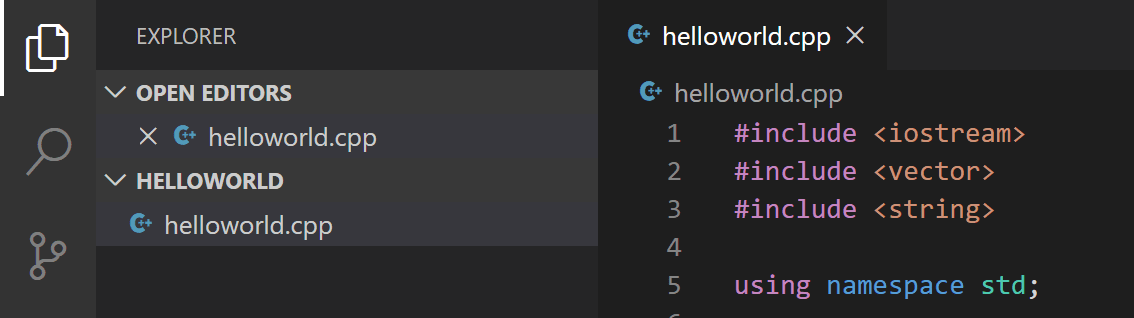
You can also enable Auto Save to automatically save your file changes, by checking Auto Save in the main File menu.
The Activity Bar on the far left lets you open different views such as Search, Source Control, and Run. You’ll look at the Run view later in this tutorial. You can find out more about the other views in the VS Code User Interface documentation.
Note: When you save or open a C++ file, you may see a notification from the C/C++ extension about the availability of an Insiders version, which lets you test new features and fixes. You can ignore this notification by selecting the X (Clear Notification).
Explore IntelliSense
In your new helloworld.cpp file, hover over vector or string to see type information. After the declaration of the msg variable, start typing msg. as you would when calling a member function. You should immediately see a completion list that shows all the member functions, and a window that shows the type information for the msg object:
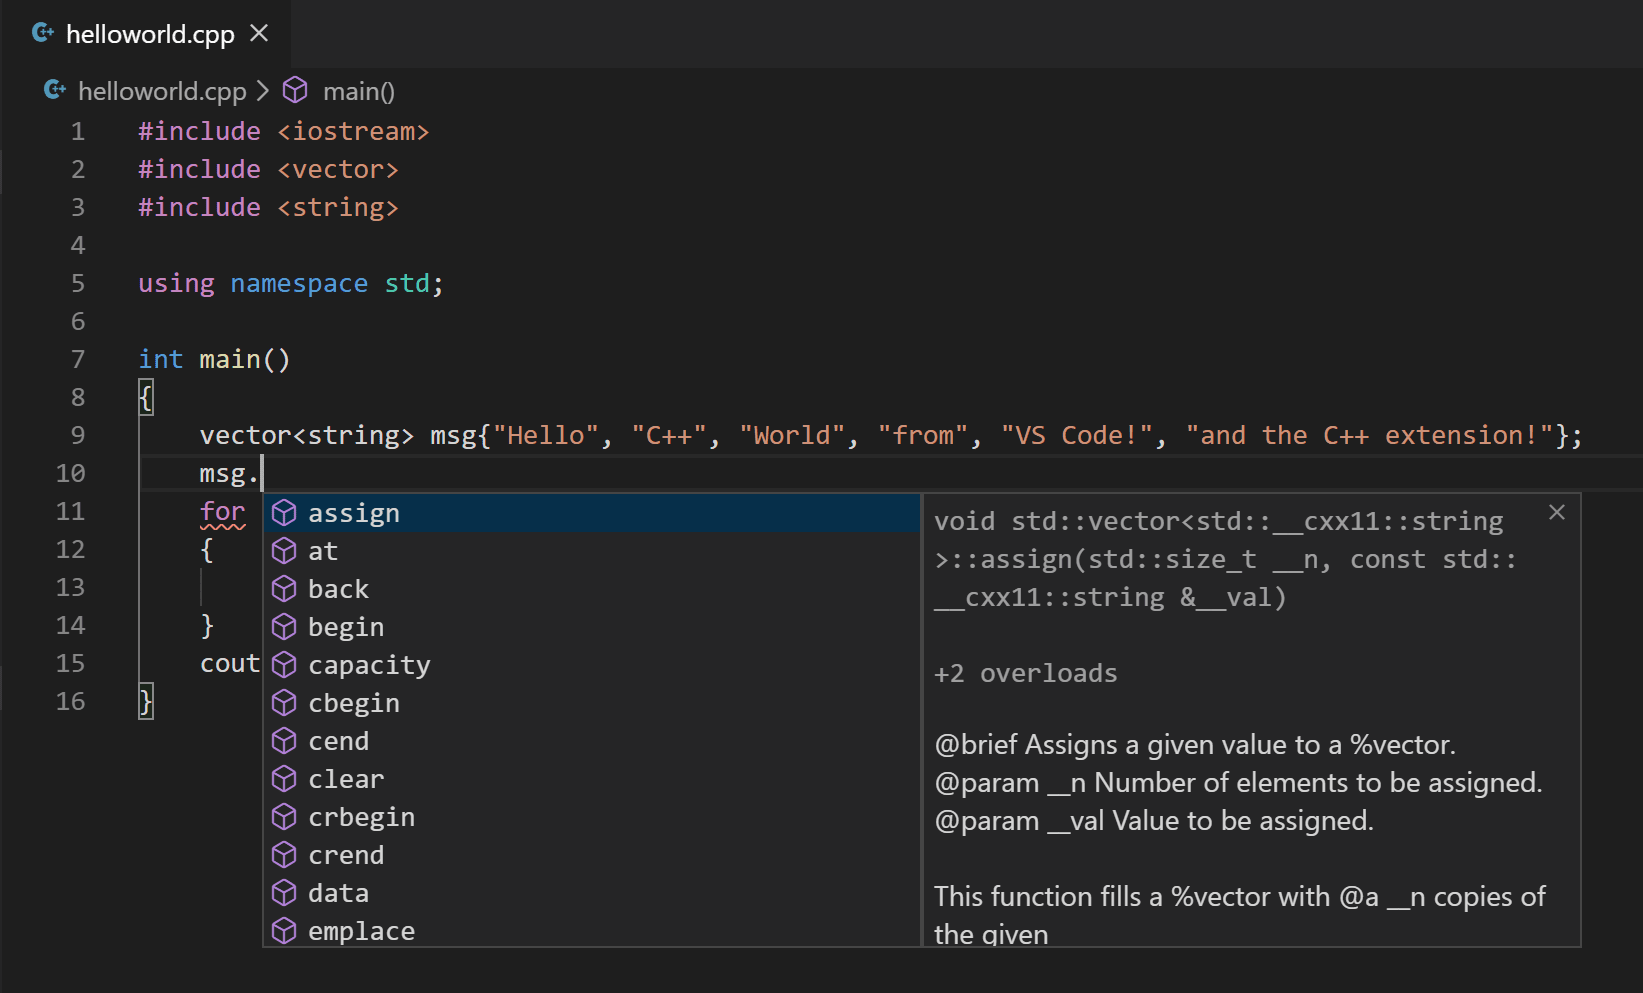
You can press the Tab key to insert the selected member; then, when you add the opening parenthesis, you will see information about any arguments that the function requires.
Run helloworld.cpp
Remember, the C++ extension uses the C++ compiler you have installed on your machine to build your program. Make sure you have a C++ compiler installed before attempting to run and debug helloworld.cpp in VS Code.
Open helloworld.cpp so that it is the active file.
Press the play button in the top right corner of the editor.
Choose C/C++: cl.exe build and debug active file from the list of detected compilers on your system.
You’ll only be asked to choose a compiler the first time you run helloworld.cpp . This compiler will be set as the "default" compiler in tasks.json file.
After the build succeeds, your program’s output will appear in the integrated Terminal.
If you get an error trying to build and debug with cl.exe, make sure you have started VS Code from the Developer Command Prompt for Visual Studio using the code . shortcut.
The first time you run your program, the C++ extension creates tasks.json , which you’ll find in your project’s .vscode folder. tasks.json stores build configurations.
Your new tasks.json file should look similar to the JSON below:
Note: You can learn more about tasks.json variables in the variables reference.
The command setting specifies the program to run; in this case that is "cl.exe". The args array specifies the command-line arguments that will be passed to cl.exe. These arguments must be specified in the order expected by the compiler.
This task tells the C++ compiler to take the active file ( $
The label value is what you will see in the tasks list; you can name this whatever you like.
The detail value is what you will as the description of the task in the tasks list. It’s highly recommended to rename this value to differentiate it from similar tasks.
The problemMatcher value selects the output parser to use for finding errors and warnings in the compiler output. For cl.exe, you’ll get the best results if you use the $msCompile problem matcher.
From now on, the play button will read from tasks.json to figure out how to build and run your program. You can define multiple build tasks in tasks.json , and whichever task is marked as the default will be used by the play button. In case you need to change the default compiler, you can run Tasks: Configure default build task. Alternatively you can modify the tasks.json file and remove the default by replacing this segment:
Modifying tasks.json
You can modify your tasks.json to build multiple C++ files by using an argument like "$
Debug helloworld.cpp
- Go back to helloworld.cpp so that it is the active file.
- Set a breakpoint by clicking on the editor margin or using F9 on the current line.
- From the drop-down next to the play button, select Debug C/C++ File.
- Choose C/C++: cl.exe build and debug active file from the list of detected compilers on your system (you’ll only be asked to choose a compiler the first time you run/debug helloworld.cpp ).
The play button has two modes: Run C/C++ File and Debug C/C++ File. It will default to the last-used mode. If you see the debug icon in the play button, you can just click the play button to debug, instead of selecting the drop-down menu item.
If you get an error trying to build and debug with cl.exe, make sure you have started VS Code from the Developer Command Prompt for Visual Studio using the code . shortcut.
Explore the debugger
Before you start stepping through the code, let’s take a moment to notice several changes in the user interface:
The Integrated Terminal appears at the bottom of the source code editor. In the Debug Output tab, you see output that indicates the debugger is up and running.
The editor highlights the line where you set a breakpoint before starting the debugger:
The Run view on the left shows debugging information. You’ll see an example later in the tutorial.
At the top of the code editor, a debugging control panel appears. You can move this around the screen by grabbing the dots on the left side.

Step through the code
Now you’re ready to start stepping through the code.
Click or press the Step over icon in the debugging control panel.
This will advance program execution to the first line of the for loop, and skip over all the internal function calls within the vector and string classes that are invoked when the msg variable is created and initialized. Notice the change in the Variables window on the left.
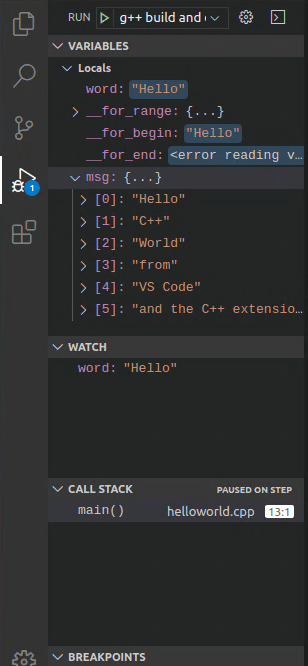
In this case, the errors are expected because, although the variable names for the loop are now visible to the debugger, the statement has not executed yet, so there is nothing to read at this point. The contents of msg are visible, however, because that statement has completed.
Press Step over again to advance to the next statement in this program (skipping over all the internal code that is executed to initialize the loop). Now, the Variables window shows information about the loop variables.
Press Step over again to execute the cout statement. (Note that as of the March 2019 release, the C++ extension does not print any output to the Debug Console until the loop exits.)
If you like, you can keep pressing Step over until all the words in the vector have been printed to the console. But if you are curious, try pressing the Step Into button to step through source code in the C++ standard library!
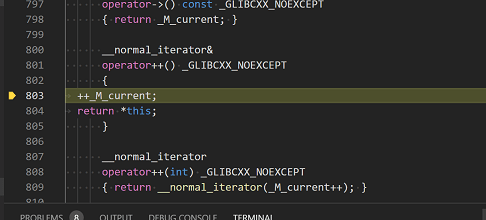
To return to your own code, one way is to keep pressing Step over. Another way is to set a breakpoint in your code by switching to the helloworld.cpp tab in the code editor, putting the insertion point somewhere on the cout statement inside the loop, and pressing F9 . A red dot appears in the gutter on the left to indicate that a breakpoint has been set on this line.
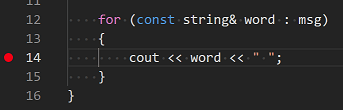
Then press F5 to start execution from the current line in the standard library header. Execution will break on cout . If you like, you can press F9 again to toggle off the breakpoint.
Set a watch
Sometimes you might want to keep track of the value of a variable as your program executes. You can do this by setting a watch on the variable.
Place the insertion point inside the loop. In the Watch window, select the plus sign and in the text box, type word , which is the name of the loop variable. Now view the Watch window as you step through the loop.
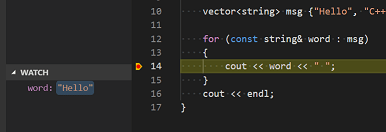
Add another watch by adding this statement before the loop: int i = 0; . Then, inside the loop, add this statement: ++i; . Now add a watch for i as you did in the previous step.
To quickly view the value of any variable while execution is paused on a breakpoint, you can hover over it with the mouse pointer.
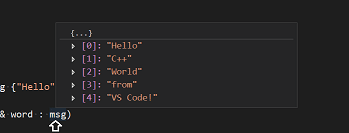
Customize debugging with launch.json
When you debug with the play button or F5 , the C++ extension creates a dynamic debug configuration on the fly.
There are cases where you’d want to customize your debug configuration, such as specifying arguments to pass to the program at runtime. You can define custom debug configurations in a launch.json file.
To create launch.json , choose Add Debug Configuration from the play button drop-down menu.
You’ll then see a dropdown for various predefined debugging configurations. Choose C/C++: cl.exe build and debug active file.
VS Code creates a launch.json file, which looks something like this:
In the JSON above, program specifies the program you want to debug. Here it is set to the active file folder ( $
By default, the C++ extension won’t add any breakpoints to your source code and the stopAtEntry value is set to false .
Change the stopAtEntry value to true to cause the debugger to stop on the main method when you start debugging.
From now on, the play button and F5 will read from your launch.json file when launching your program for debugging.
C/C++ configurations
If you want more control over the C/C++ extension, you can create a c_cpp_properties.json file, which will allow you to change settings such as the path to the compiler, include paths, C++ standard (default is C++17), and more.
You can view the C/C++ configuration UI by running the command C/C++: Edit Configurations (UI) from the Command Palette ( ⇧⌘P (Windows, Linux Ctrl+Shift+P ) ).
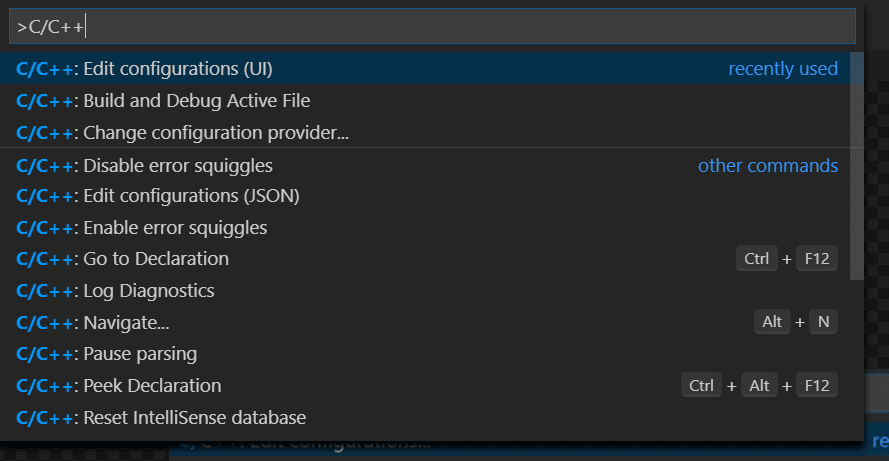
This opens the C/C++ Configurations page. When you make changes here, VS Code writes them to a file called c_cpp_properties.json in the .vscode folder.
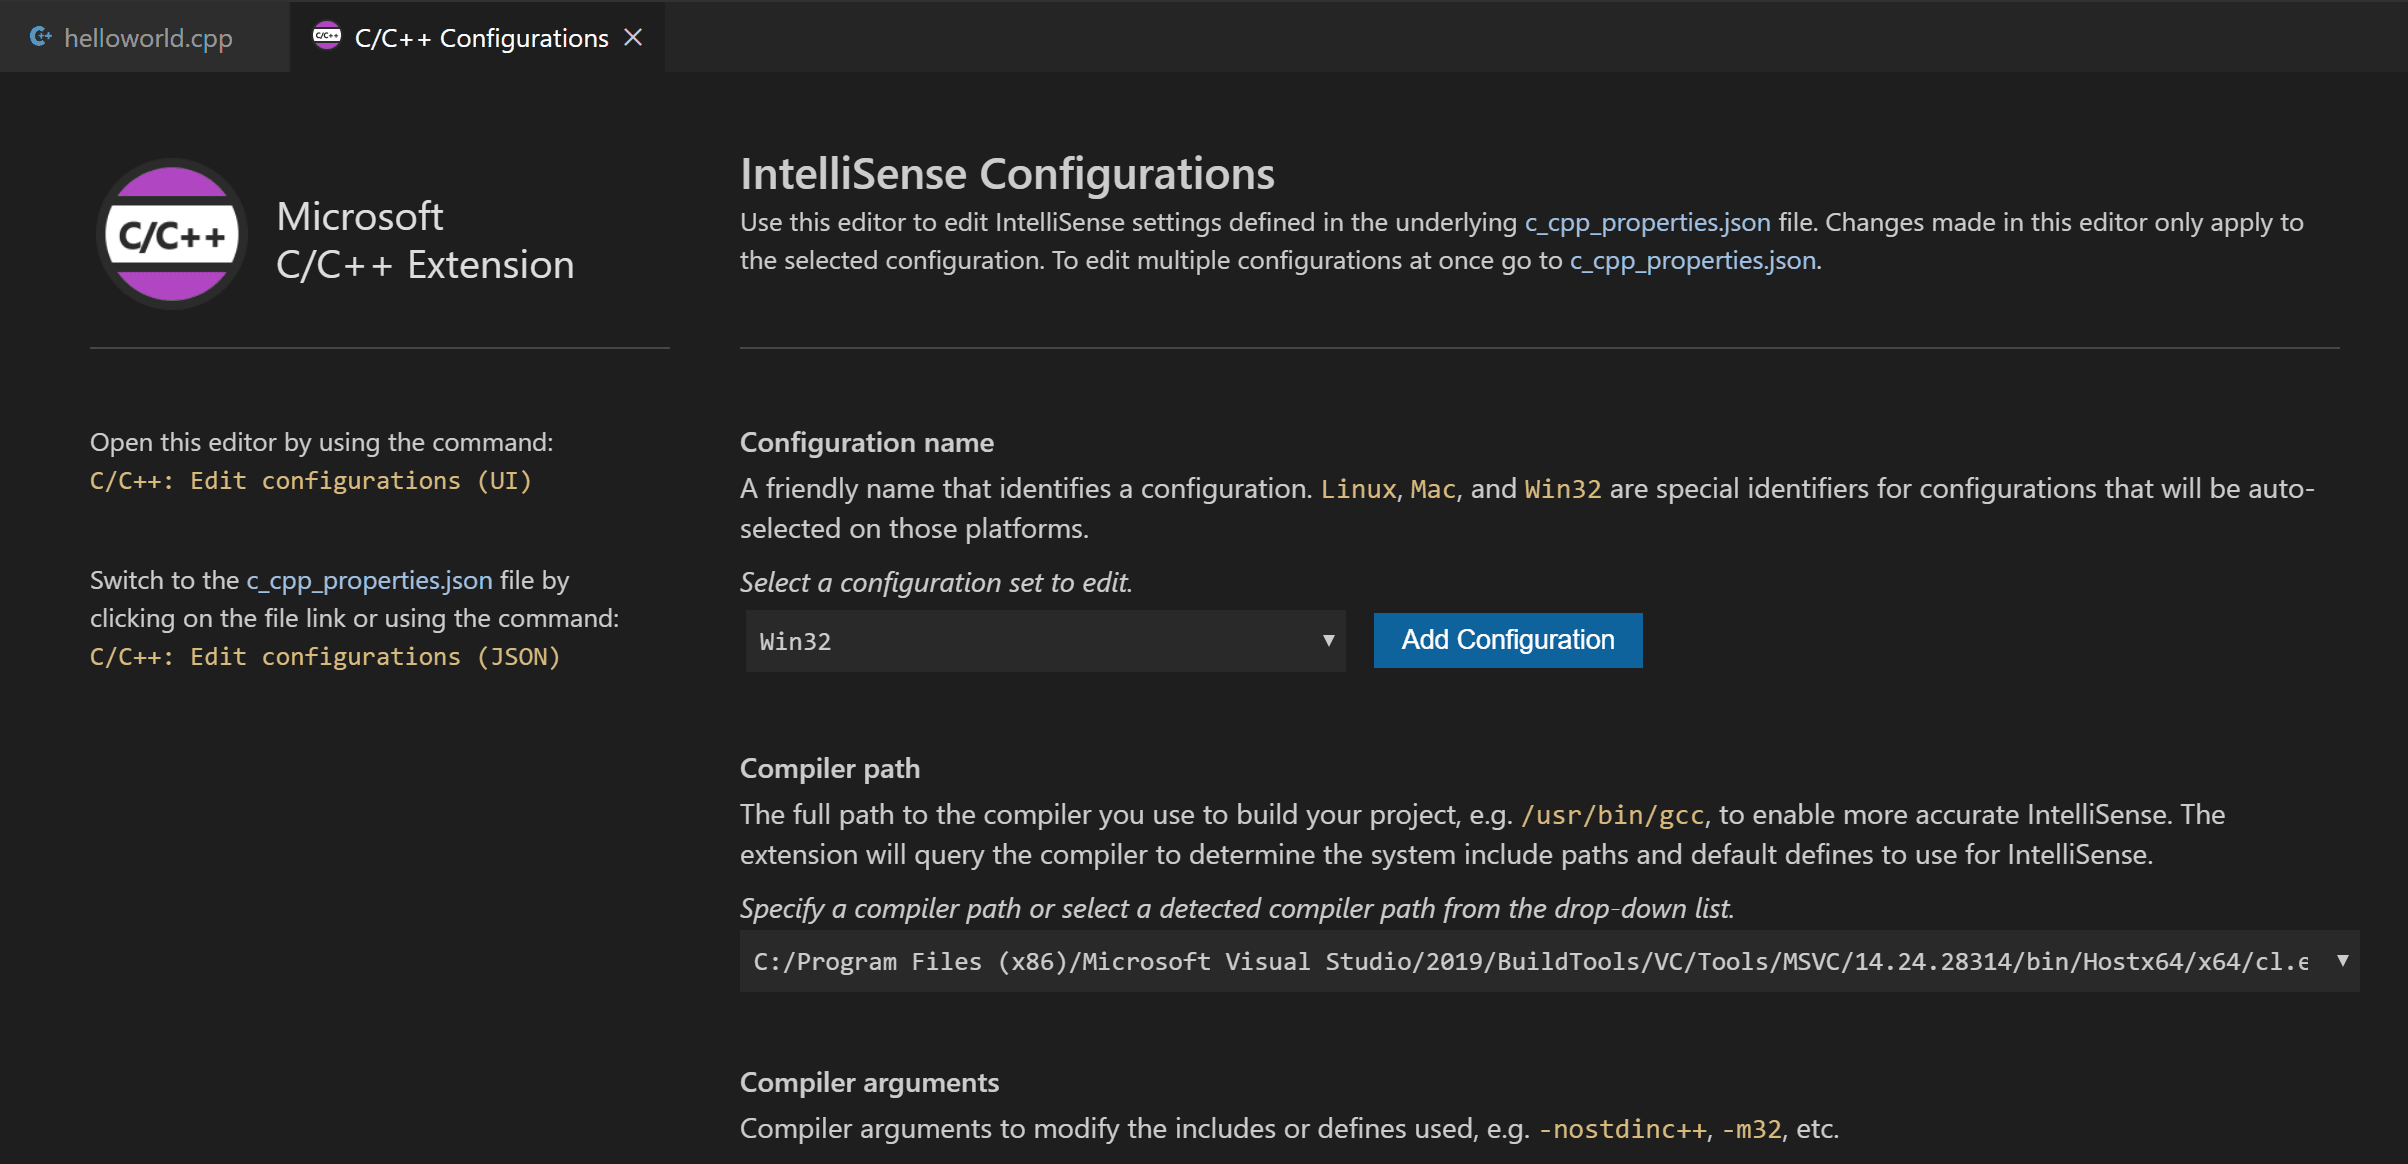
Visual Studio Code places these settings in .vscode\c_cpp_properties.json . If you open that file directly, it should look something like this:
You only need to add to the Include path array setting if your program includes header files that are not in your workspace or in the standard library path.
Compiler path
The compilerPath setting is an important setting in your configuration. The extension uses it to infer the path to the C++ standard library header files. When the extension knows where to find those files, it can provide useful features like smart completions and Go to Definition navigation.
The C/C++ extension attempts to populate compilerPath with the default compiler location based on what it finds on your system. The extension looks in several common compiler locations.
The compilerPath search order is:
- First check for the Microsoft Visual C++ compilerOpe
- Then look for g++ on Windows Subsystem for Linux (WSL)
- Then g++ for Mingw-w64.
If you have g++ or WSL installed, you might need to change compilerPath to match the preferred compiler for your project. For Microsoft C++, the path should look something like this, depending on which specific version you have installed: "C:/Program Files (x86)/Microsoft Visual Studio/2017/BuildTools/VC/Tools/MSVC/14.16.27023/bin/Hostx64/x64/cl.exe".
Reusing your C++ configuration
VS Code is now configured to use the Microsoft C++ compiler. The configuration applies to the current workspace. To reuse the configuration, just copy the JSON files to a .vscode folder in a new project folder (workspace) and change the names of the source file(s) and executable as needed.
Run VS Code outside the Developer Command Prompt
In certain circumstances, it isn’t possible to run VS Code from Developer Command Prompt for Visual Studio (for example, in Remote Development through SSH scenarios). In that case, you can automate initialization of Developer Command Prompt for Visual Studio during the build using the following tasks.json configuration:
Note: The path to VsDevCmd.bat might be different depending on the Visual Studio version or installation path. You can find the path to VsDevCmd.bat by opening a Command Prompt and running dir "\VsDevCmd*" /s .
Troubleshooting
The term ‘cl.exe’ is not recognized
If you see the error "The term ‘cl.exe’ is not recognized as the name of a cmdlet, function, script file, or operable program.", this usually means you are running VS Code outside of a Developer Command Prompt for Visual Studio and VS Code doesn’t know the path to the cl.exe compiler.
VS Code must either be started from the Developer Command Prompt for Visual Studio, or the task must be configured to run outside a Developer Command Prompt.